Model A Guitar Sample
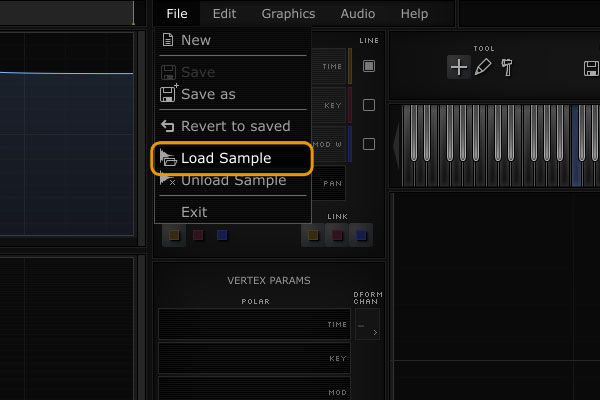
Load a wave file with the dialog.
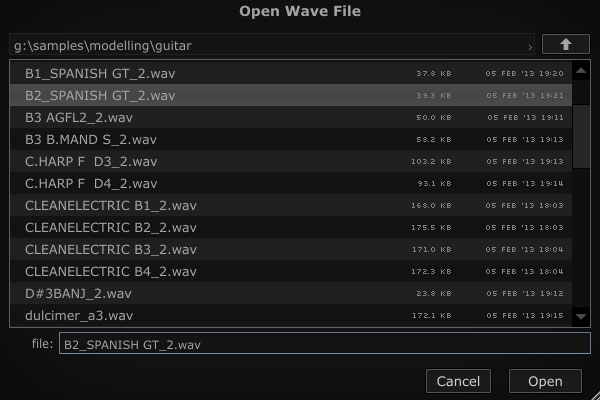
Select the sample. It's best if the sound is a single voice
with the least amount of reverb and effects applied. I'm using a
guitar sound here.
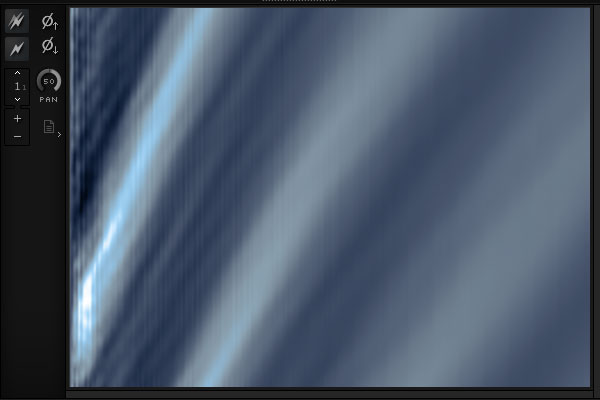
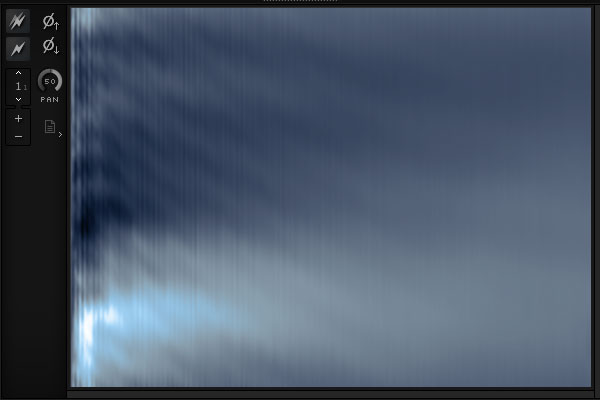
We can see the waveform surface is phasing upward, so the pitch
envelope didn't track perfectly. We should fix this to make the
modelling job easier.
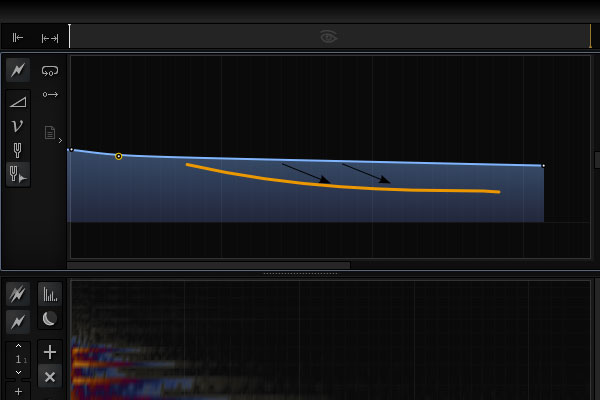
Adjust the pitch envelope until the waveform surface levels out.
Now the surface and the phase domain are simplified.
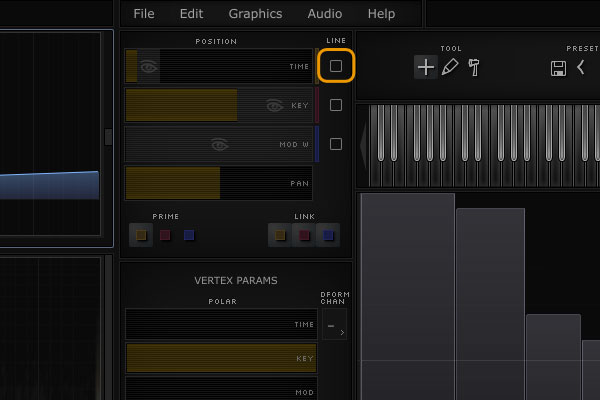
Before we trace the waveshape in the 2D waveform view, make
sure the 'line' button for Time is unchecked. This makes newly
added lines have unit depth, as opposed to the current view
depth.
If the attack part of the sample is noisy or irregular, put the
playback cursor to where it's more stable. Trace the general
shape of the waveform.
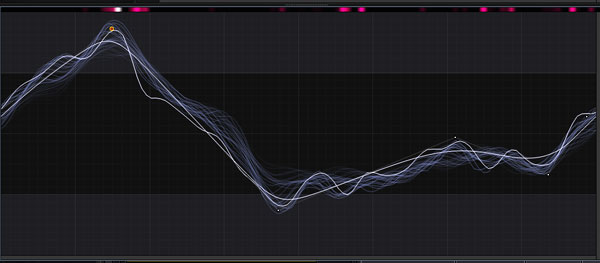
The phase spectrum will look a bit like this. Many higher harmonics are undefined.
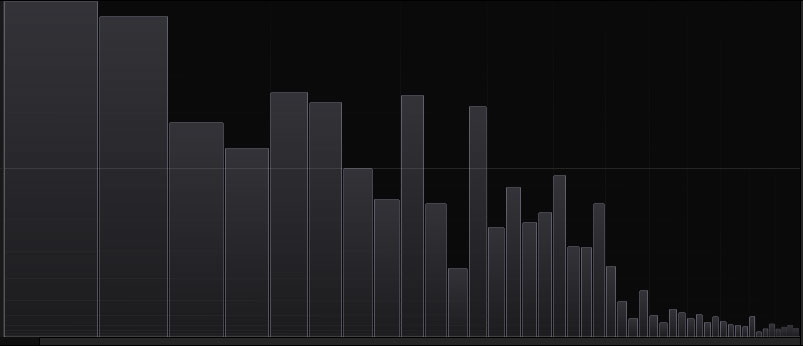
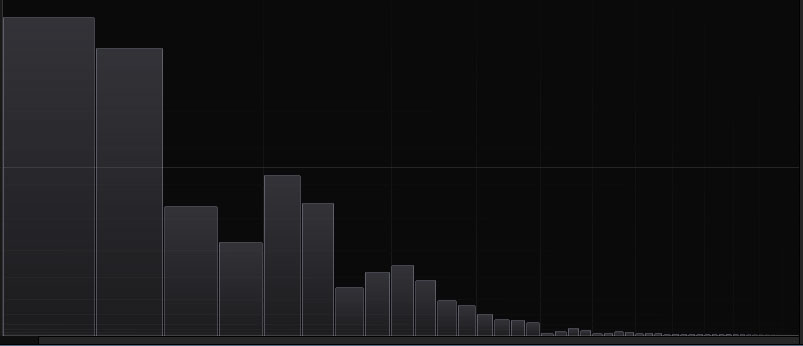
Here is the sample's spectrum. Hit 'w' to toggle between the
synth and wave views.
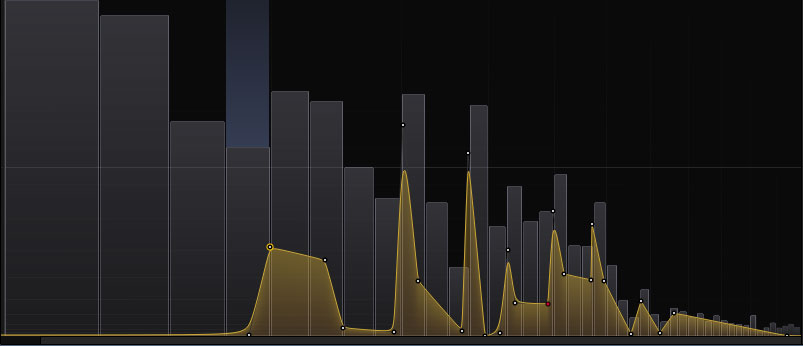
Identify the prominent harmonics that are missing from the
synth spectrum, and fill them in.
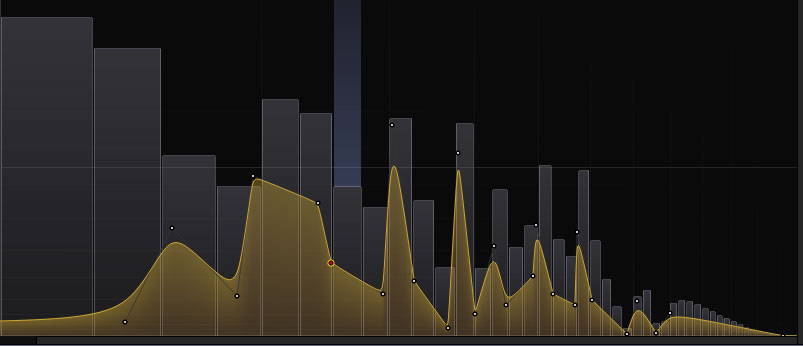
Adjust the curve until the harmonic profiles of the synth and sample are alike.
The spectrum is still static over time.
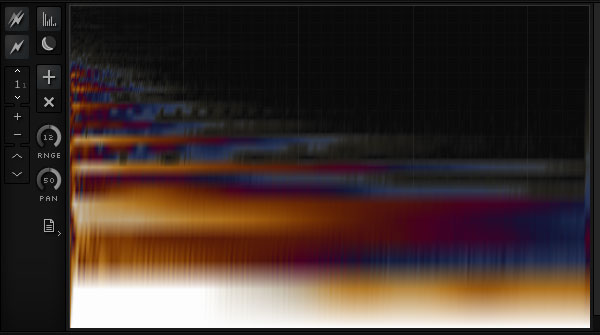
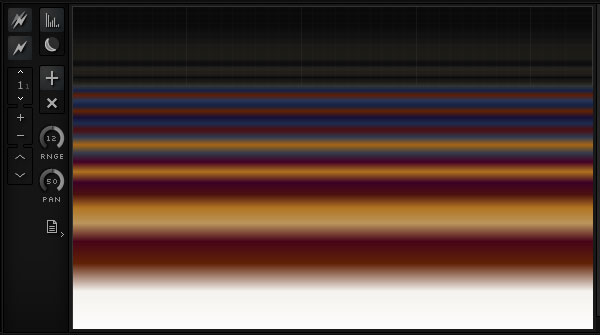
The sample's spectrogram. We now want to model the decay.
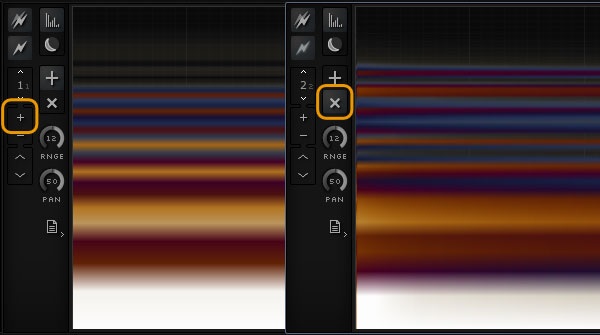
To accomplish this, we are going to add a new layer that will
behave like a filter. Click the '+' button to add a layer, then
click the 'x' button to make it a multiplicative layer, as opposed to additive.
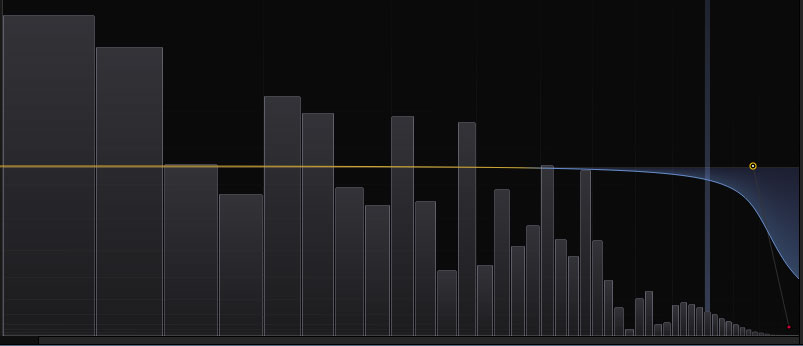
Define a filter rolloff at the top of the spectrum.
Unlink time (yellow). This will let you move the ends of the
lines independently.
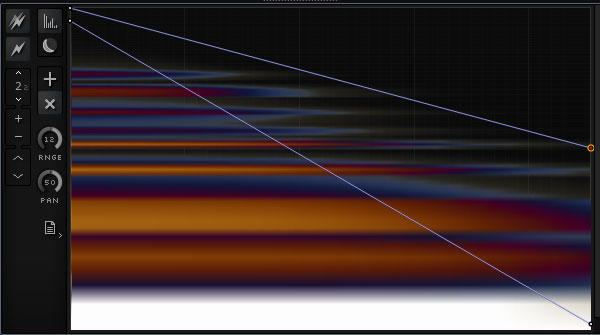
In the spectrogram view, drag the end verts down.
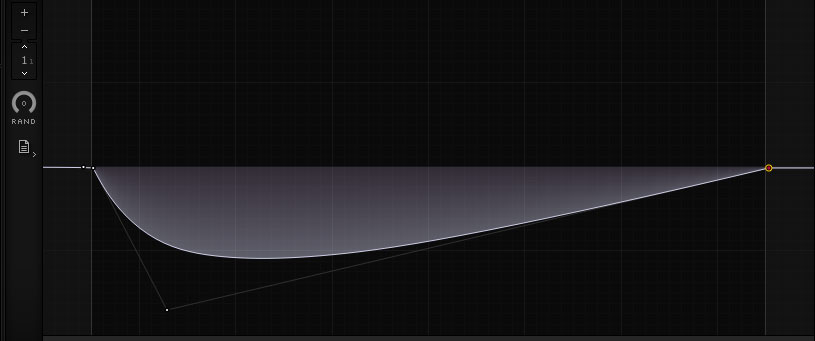
The decay is more exponential than linear, so we will deform the lines to better match the decay curve.
Click the deformer tab, and define a curve like this.
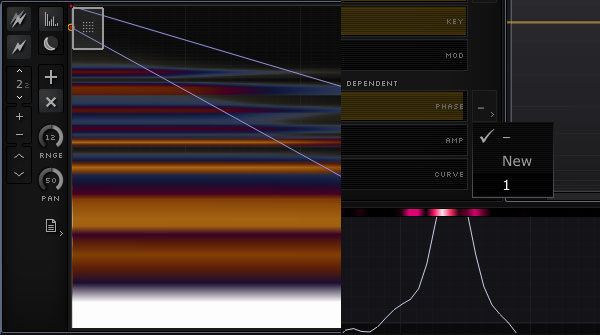
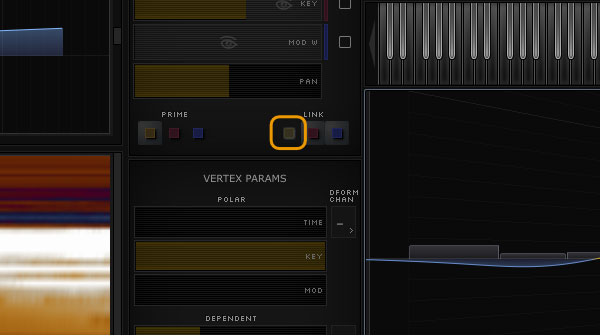
Box select the starting spectrogram vertices (shift + left
drag), then in the Vertex Properties select '1' for the Phase
deform channel.
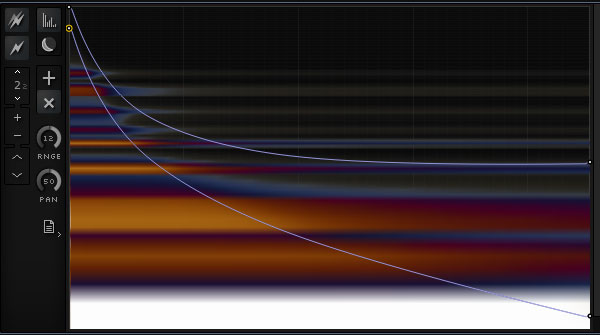
We're most of the way with the amplitude spectrum.
To be continued...
|
Load a wave file with the dialog. |
Select the sample. It's best if the sound is a single voice with the least amount of reverb and effects applied. I'm using a guitar sound here. |
We can see the waveform surface is phasing upward, so the pitch envelope didn't track perfectly. We should fix this to make the modelling job easier. |
|
Adjust the pitch envelope until the waveform surface levels out. |
Now the surface and the phase domain are simplified. |
Before we trace the waveshape in the 2D waveform view, make sure the 'line' button for Time is unchecked. This makes newly added lines have unit depth, as opposed to the current view depth. |
|
If the attack part of the sample is noisy or irregular, put the playback cursor to where it's more stable. Trace the general shape of the waveform. |
The phase spectrum will look a bit like this. Many higher harmonics are undefined. |
Here is the sample's spectrum. Hit 'w' to toggle between the synth and wave views. |
|
Identify the prominent harmonics that are missing from the synth spectrum, and fill them in. |
Adjust the curve until the harmonic profiles of the synth and sample are alike. |
The spectrum is still static over time. |
|
The sample's spectrogram. We now want to model the decay. |
To accomplish this, we are going to add a new layer that will behave like a filter. Click the '+' button to add a layer, then click the 'x' button to make it a multiplicative layer, as opposed to additive. |
Define a filter rolloff at the top of the spectrum. |
|
Unlink time (yellow). This will let you move the ends of the lines independently. |
In the spectrogram view, drag the end verts down. |
The decay is more exponential than linear, so we will deform the lines to better match the decay curve. Click the deformer tab, and define a curve like this. |
|
Box select the starting spectrogram vertices (shift + left drag), then in the Vertex Properties select '1' for the Phase deform channel. |
We're most of the way with the amplitude spectrum. |
To be continued... |